Line graphs
<line-graph> draws a line through a series of values: coloured per point, straight, smooth or stepped, with optional points, an average line and a solid or patterned fill. It is geometry, not elements, so a graph of any length costs one draw.
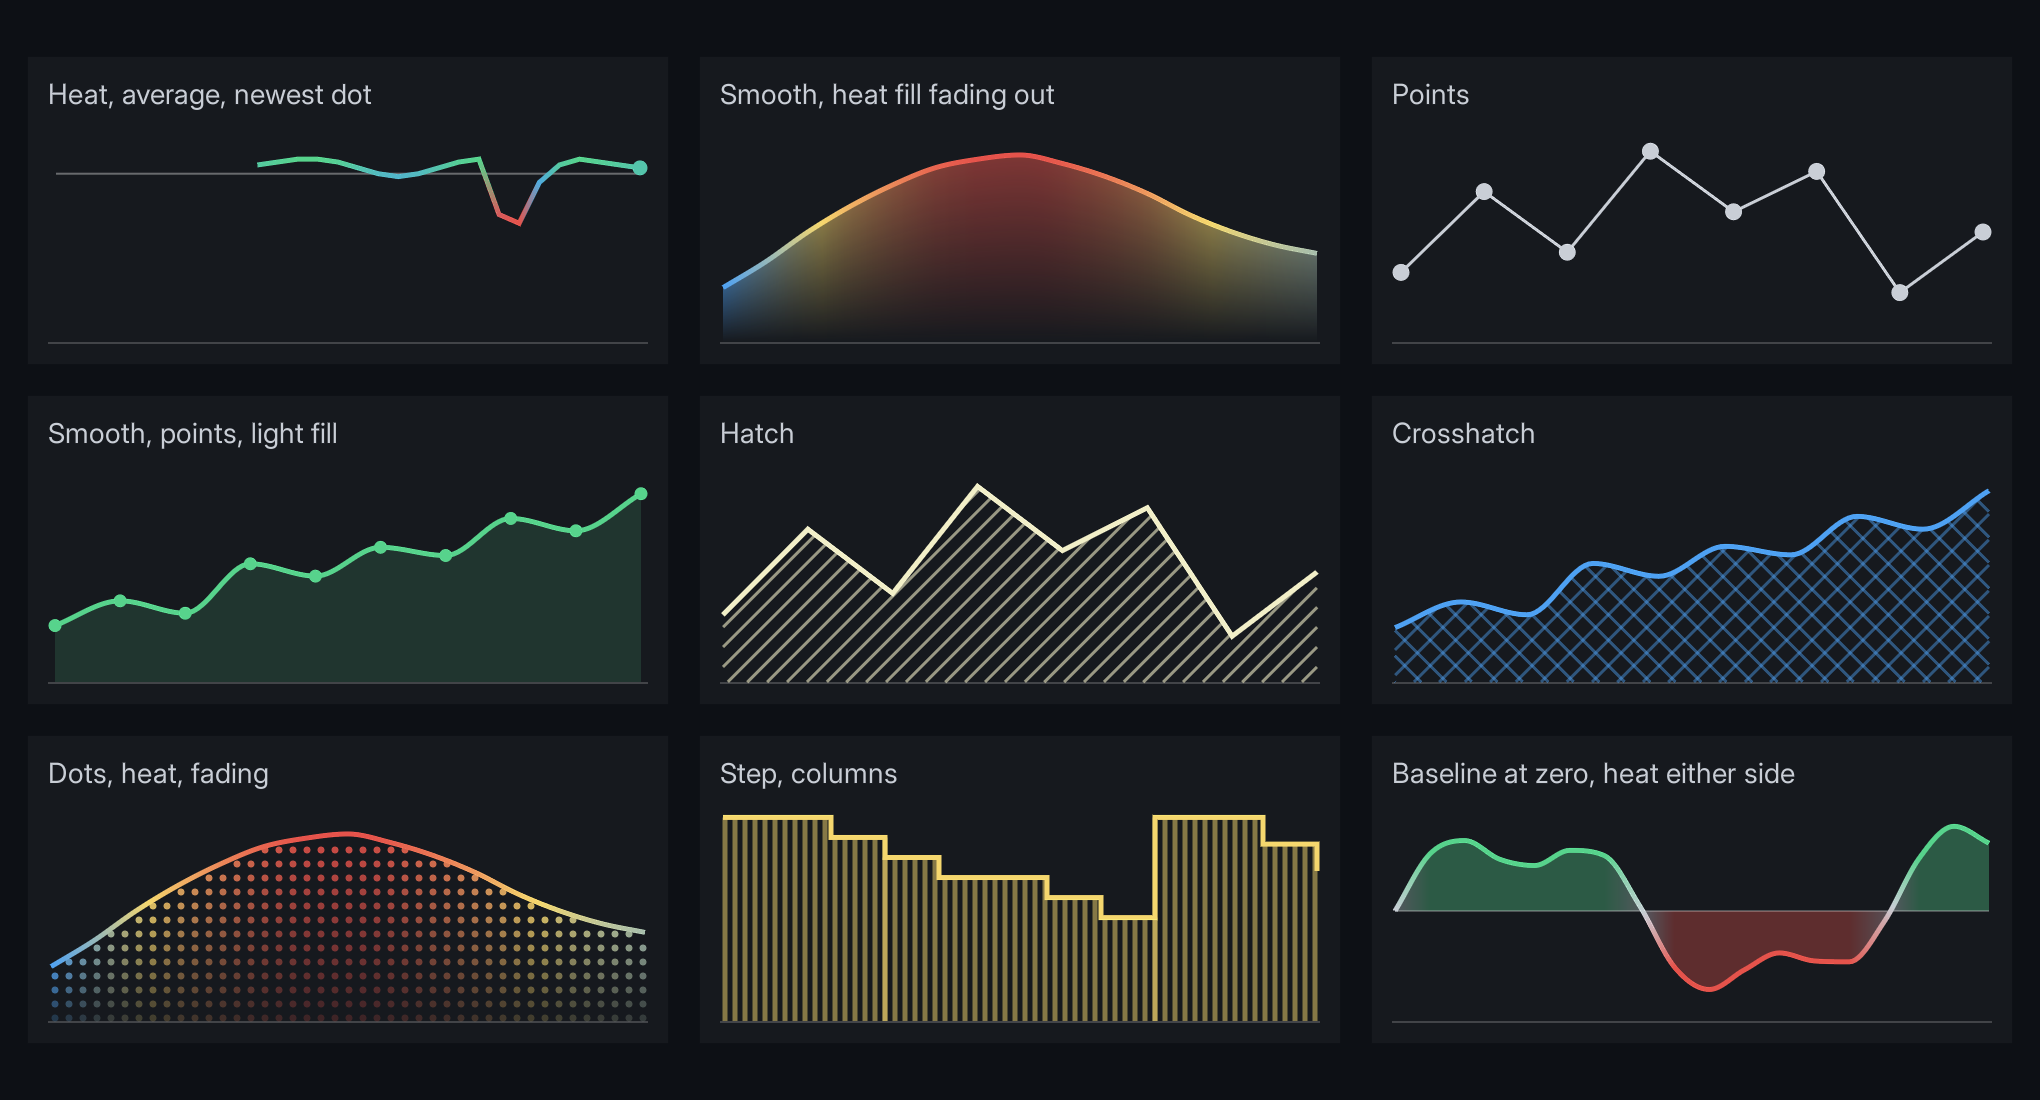
<line-graph data-attr-values="g.Values" data-attr-tones="g.Tones" data-attr-average="g.Average" data-attr-length="60"></line-graph>line-graph { display: block; height: 40dp; }Give it a size: it has no intrinsic one. Every graph above is in examples/line_graph_styles.rml, with its data in UI/mock/line_graph_styles.json. For a walkthrough from a mock file to game code, see A weapon falloff graph.
Attributes
values | One string of numbers, oldest first, separated by spaces or commas. Not a JSON array. |
min, max | The range values, average and baseline are in: min is the bottom of the content box, max the top. 0 and 1 when left out. Values outside are clamped. |
tones | One per value, -1 to 1. -1 draws in graph-low-color, 0 in graph-mid-color, 1 in graph-high-color, blended between. Missing tones draw at 0. |
average | A value for a horizontal line. Leave it out for none. |
baseline | The value the fill reaches to, so it can sit above and below a zero line. The bottom of the content box when left out. |
length | How many values fill the width. Fewer sit at the right edge, so a history that is still filling grows leftwards instead of stretching. Leave it out to spread the values across the width. |
Tones are the model's call: the element knows nothing about what is good or bad. A frame rate maps high to 1; a temperature might map high to -1, or swap the colours in RCSS instead.
Troubleshooting
Values can only be retrieved from scalar data types:valuesortonesis bound to an array. Make it a string,"0.9 0.8 0.6".- Nothing draws: the element has no height, or
valuesis empty or unparseable. Parsing stops at the first thing that is not a number. - The line sits flat along the top or bottom: the values are outside
mintomax. Set those to the data's range. - The line stretches as data arrives: set
length. - The fill does not show:
graph-fill-opacityis 0 by default.
Properties
| Default | ||
|---|---|---|
graph-low-color | #e5534b | Tone -1. |
graph-mid-color | #4ea1f3 | Tone 0, and every point when there are no tones. |
graph-high-color | #57d38c | Tone 1. |
graph-average-color | #ffffff5a | |
graph-line-width | 2dp | 0 for no line, such as a fill or points on their own. |
graph-curve | linear | smooth curves through every value without overshooting a peak. step holds each value until the next. |
graph-dot-size | 6dp | The dot on the newest value. 0 for none. |
graph-point-size | 0dp | A dot on every value. |
graph-fill-opacity | 0 | The fill between the line and the baseline, 0 to 1. It takes the line's colour, tones included. |
graph-fill-fade | 0 | How far the fill fades out toward the baseline: 0 is even, 1 reaches nothing. |
graph-fill-pattern | solid | hatch, crosshatch, columns, rows or dots. |
graph-fill-spacing | 6dp | The pattern's pitch. |
graph-fill-width | 1dp | The pattern's line width, or the diameter of a dot. |
opacity applies to the whole graph. The line and dots are inset by the largest dot's radius so none is clipped at the edges. Patterns are anchored to the element, so they stay still while a live line moves over them.